
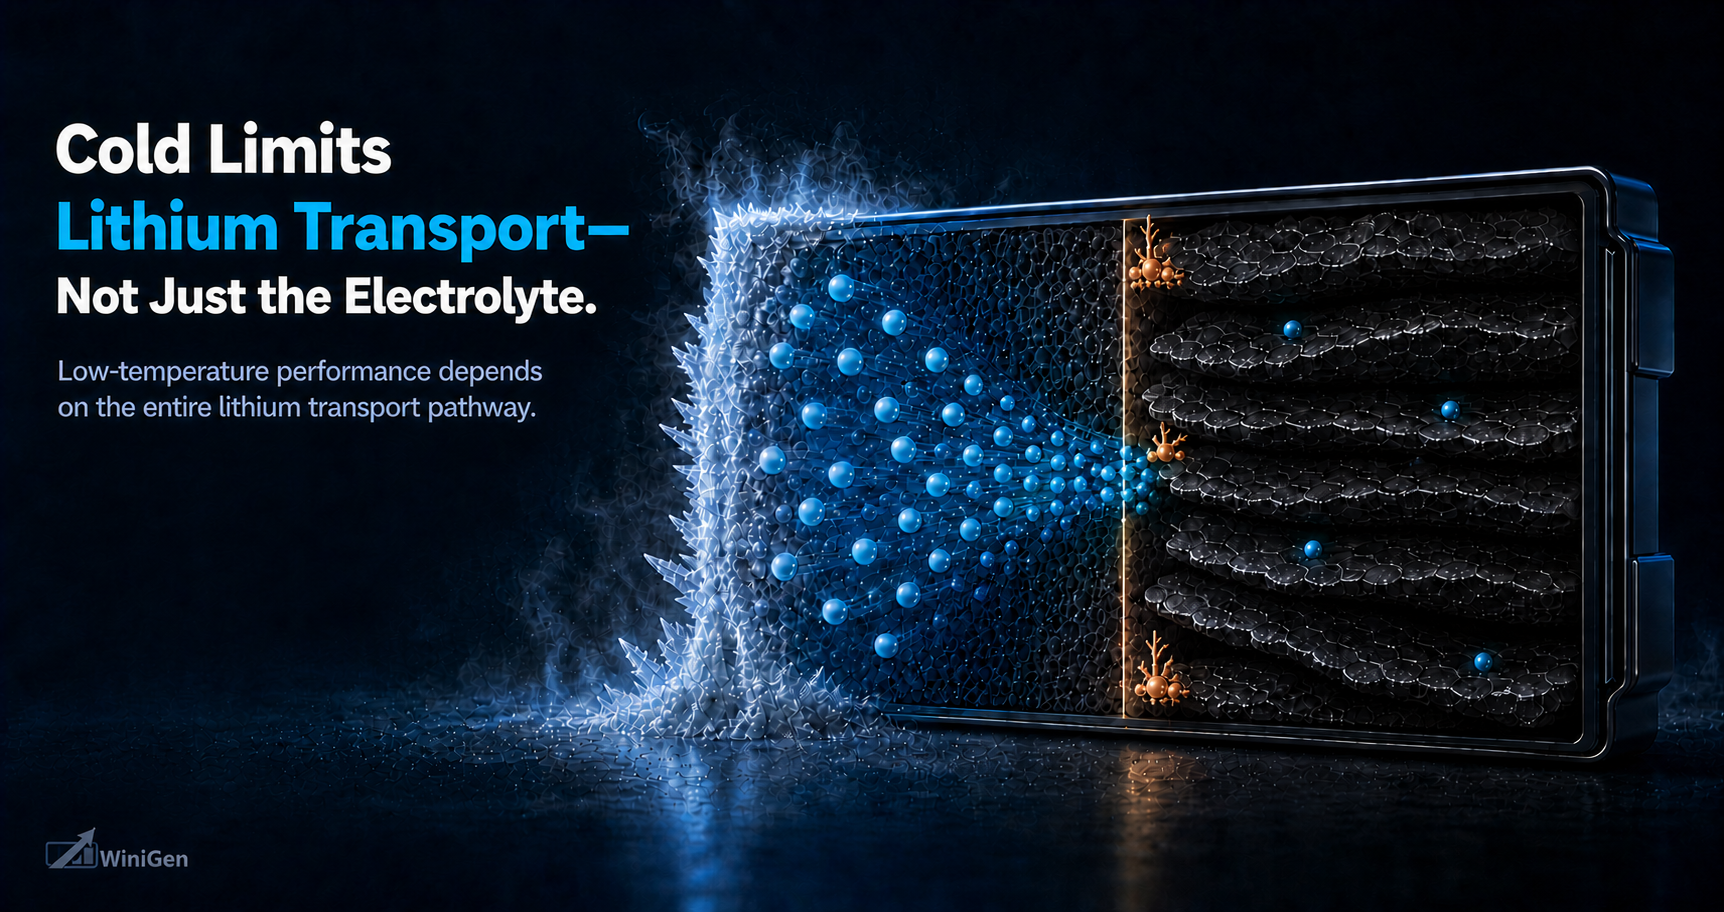
Low temperature does not degrade a lithium-ion cell through one mechanism. As the temperature falls, ionic transport slows, interfacial resistance rises, concentration gradients steepen, and graphite becomes less able to accept lithium safely during charge. At that point, the performance of the electrolyte can no longer be separated from the architecture and operating conditions of the cell.
For consistency, this article defines the ultra-low-temperature domain as temperatures below −20°C. This is a reporting boundary rather than a universal physical threshold. Within this range, the dominant limitation may shift with chemistry, state of charge, aging, electrode loading, cell format, current, and thermal conditions.
This distinction matters because the literature often compresses very different demonstrations into a single statement such as “the battery operates at −70°C.” A cell charged at 25°C and discharged once at −70°C has demonstrated cold discharge, not cold rechargeability. Likewise, a thin, electrolyte-rich coin cell may retain capacity while a practical ampere-hour pouch cell reaches its voltage cutoff much earlier. The scientific claim should be no broader than the test protocol and cell design that support it.

1. What Does “Works at Low Temperature” Actually Mean?
“Works at low temperature” may mean electrolyte liquidity, discharge energy, pulse power, rechargeability, repeated cycling, or operation in a realistic cell. Evaluation must begin by identifying the demonstrated function.
| Demonstration | What should be reported | What it establishes |
|---|---|---|
| Electrolyte remains liquid | Phase behavior, hold time, conductivity, viscosity, and thermal history | The electrolyte remains physically mobile under the test conditions |
| Cold discharge | Charge temperature, cold soak, discharge temperature, rate, cutoff, voltage curve, capacity, and energy | The cell can deliver energy at low temperature |
| Cold power | SOC, pulse duration, rest time, voltage limit, power, resistance, and temperature rise | The cell can deliver short-duration power without excessive voltage collapse |
| Cold rechargeability | Charge temperature and rate, graphite potential or other plating evidence, Coulombic efficiency, rest behavior, and recovery | The cell can accept lithium safely at low temperature |
| Same-temperature cold cycling | Charge and discharge at the stated temperature, cycle count, efficiency, capacity or energy retention, and recovery | The cell can operate repeatedly under the stated cold condition |
| Practical-cell validation | Cell format, capacity, electrode loading, thickness, porosity, N/P ratio, electrolyte quantity, pressure, and current-collection design | The result is relevant to a realistic cell architecture |
Capacity retention also needs a clear reference: normalization at the same room-temperature rate is not equivalent to normalization against a slower baseline. Full voltage curves are preferable because lower voltage and earlier cutoff can reduce delivered energy even when capacity remains.

2. Why Limitations Couple as Temperature Falls
Cooling increases electrolyte viscosity, reduces ionic mobility, and can change ion association and effective carrier concentration. Porous-electrode concentration and potential gradients steepen while Li+ desolvation, SEI transport, charge transfer, and solid-state diffusion slow.[2]
These processes do not act independently. They consume the same finite voltage margin. During discharge, a useful schematic expression is
The polarization terms represent pore transport, interphase transport, charge transfer, and solid diffusion. Their growth lowers discharge voltage and advances cutoff; during charge, it raises the required terminal voltage and can move the graphite surface toward plating. Exact signs depend on convention, but every loss consumes the same electrochemical margin.
Porous-electrode architecture amplifies the bulk electrolyte penalty. A common representation is
Here, κ is bulk conductivity, ε connected porosity, and τf the tortuosity factor; equivalent forms follow from other tortuosity definitions. Thick, poorly connected coatings amplify a decrease in κ. Reaction may then shift toward the separator, leaving deeper material underutilized and increasing interfacial current density and plating risk.[10]

A thin, low-loading coin-cell electrode can therefore conceal a limitation that dominates in a practical coating.[4]
Bulk conductivity is only one part of the response. Chen et al. reduced the apparent activation energies assigned to SEI transport and charge transfer by changing solvation.[1] Xu et al. used three-electrode pouch cells to show that graphite remained above 0 V versus Li/Li+ at −30°C under their tested condition.[3] Together, these results show that formulation changes interfacial kinetics as well as bulk mobility, while electrode-potential measurements directly test the charging condition.
The controlling process can shift among bulk and pore transport, desolvation, SEI conduction, charge transfer, and solid diffusion with chemistry, state, age, loading, current, and format. The design target is therefore the full polarization spectrum, not one electrolyte property.
For reporting purposes, this article uses four temperature intervals:
| Temperature range | Engineering interpretation |
|---|---|
| 0 to −20°C | Cold operation with chemistry- and design-dependent transport and kinetic penalties |
| −20 to −40°C | Increasingly coupled transport and kinetic limitations |
| −40 to −60°C | Large transport and kinetic penalties often require electrolyte–architecture co-design |
| Below −60°C | Specialized chemistry, aggressive derating, active heating, or a combination of these approaches |
These intervals organize comparison for a stated chemistry and design. They are not phase boundaries and do not imply that the same process becomes rate controlling in every cell at the same temperature.
3. What Landmark Ultra-Low-Temperature Studies Demonstrate
The lowest reported temperature is not enough to compare low-temperature battery studies. The result must be interpreted together with the charge and discharge temperatures, cycle count, cell format, electrode loading, electrolyte quantity, and rate. The three primary studies below use different electrolyte concepts and establish different levels of practical evidence.
| Study | Cell and practical context | Cold protocol | Reported result and interpretation |
|---|---|---|---|
| Chen et al.[1] | 1 Ah, 4.5 V graphite-based pouch | One cycle entirely at −60°C; separate 25°C charge followed by −70°C discharge | 334 mAh for the −60°C same-temperature cycle. Separate −70°C discharge delivered 716 mAh, reported as 61% of 25°C capacity. |
| Xu et al.[3] | NMC811/graphite coin cells, >2.5 mAh cm−2; pouch validation at 2.5 g Ah−1 E/C | Same-temperature charge/discharge to −60°C; pouch cycling at −30°C | 75% at −50°C and 54% at −60°C at 0.1C. Pouch cycling at −30°C with >99.9% average CE. |
| Lu et al.[5] | 1.2 Ah graphite/NMC811 pouch, 2.85 mAh cm−2 | Same-temperature charge and discharge at −65°C | 0.62 Ah reversible capacity at −65°C in an Ah-scale, practical-loading pouch cell. |

These studies are complementary, not rank-ordered by minimum temperature. Chen et al.’s −70°C result demonstrates discharge after room-temperature charging; its separate −60°C result adds one-cycle same-temperature evidence. The meaningful comparison is the demonstrated function, cell design, and support for safe, repeatable operation.
4. Low-Temperature Electrolyte Design Is a Multi-Objective Problem
Electrolyte properties do not improve together automatically. Lower viscosity and weaker Li+ coordination can aid transport and desolvation, yet poor salt dissociation reduces mobile carriers. Fluorination may improve phase or interphase behavior while affecting viscosity, density, cost, stability, and compatibility. The target is a balance of bulk transport, interfacial exchange, phase stability, and durability.
4.1 Remain mobile through the full thermal history
Pure-solvent melting points do not define the phase behavior of a formulation. Concentration, solvent ratio, additives, ion association, supercooling, nucleation, and glass formation shift the apparent liquid range. Cooling and heating traces are both needed because a clear, rapidly cooled sample may be a metastable liquid.
Conductivity and viscosity should follow a defined thermal history and equilibration period; cooling rate, quenching, holds, and partial crystallization all affect interpretation.
4.2 Dissociate salt without binding Li+ too strongly
Strongly coordinating solvents can improve salt dissociation but raise the desolvation penalty at graphite. Very weak solvation can ease interfacial exchange yet suppress conductivity through insufficient dissociation or poor transport connectivity. A balanced environment must sustain carriers while permitting rapid solvent exchange.

4.3 Form an interphase that conducts Li+ with minimal polarization
The SEI must suppress electron transfer and electrolyte reduction while preserving Li+ transport, contact, and chemical stability. Labels such as “LiF-rich” omit thickness, continuity, defects, organic fraction, and formation history—all determinants of resistance.[2] A moderate-conductivity electrolyte can therefore outperform one with higher bulk conductivity if desolvation and SEI transport are faster.
4.4 Remain compatible with the complete high-voltage cell
Nitriles, ethers, esters, carbonates, and fluorinated solvents trade volatility, flammability, oxidation stability, viscosity, density, and graphite compatibility.[6] Concentrated, dual-salt, and high-entropy formulations also alter ion association, aluminum corrosion, wetting, interphase precursors, cost, and processing.[2]
A favorable lithium-metal half-cell result does not establish compatibility with graphite, aluminum, or a 4.3–4.5 V cathode. Full-cell tests should reproduce representative cathode surface area and voltage and assess current-collector corrosion, gas generation, formation efficiency, storage, and cycling.
5. Graphite Often Sets the Safe Cold-Charging Limit
In graphite-based cells, the negative electrode often sets the safe charging limit at low temperature. Cold-discharge voltage and energy reflect polarization across the full cell, but cold rechargeability depends critically on whether graphite can accept the incoming lithium without metallic deposition.
During charge, Li+ must move through the electrolyte-filled pore network, shed its solvation shell, cross the SEI, and enter graphite. These steps determine the kinetically accessible insertion flux under the stated condition. If lithium arrives faster than it can be inserted, surface polarization increases and metallic deposition becomes competitive.[11]
Metallic lithium deposition becomes thermodynamically favorable when the local graphite surface potential falls below the local Li/Li+ equilibrium potential, conventionally referenced near 0 V versus Li/Li+. Actual nucleation may require additional overpotential, while a measured full-electrode or reference-electrode potential can remain above 0 V even if an unresolved local region has crossed the plating condition.[7]
The relevant safety quantity is the local lithium-receiving margin: the difference between kinetically accessible graphite insertion flux and lithium arrival flux. It depends on both remaining lithiation capacity and insertion kinetics.
Four groups of variables govern this margin: graphite particle dimensions, staging behavior, and active area; electrode loading, porosity, tortuosity, and N/P ratio; SEI condition and wetting; and SOC, current, temperature, and age. A generous average N/P ratio cannot protect a dry, compressed, or high-resistance region.[11], [12]

Aging generally shrinks or redistributes this margin. Loss of cyclable lithium changes electrode balancing and SOC alignment, while SEI growth, pore blockage, wetting changes, gas-induced contact loss, and mechanical degradation increase local resistance or reduce active area. A fresh cell that avoids plating under a given cold-charge protocol may cross the local plating boundary after extended cycling. Aged-cell validation is therefore part of charge-safety validation, not only lifetime testing.
6. Electrode and Cell Architecture Decide Whether the Electrolyte Can Work
Low-temperature scale-up contains a persistent trap: thin, low-loading laboratory electrodes shorten ionic and solid-state transport distances, while coin cells often provide excess electrolyte, favorable external heat transfer, comparatively constrained stack geometry, and short electronic paths. A formulation that performs well under those conditions can polarize much more strongly when transferred to a thick coating, lean E/C, ampere-hour format, or less favorable thermal boundary. The same chemistry therefore does not guarantee the same low-temperature cell response.[4]
6.1 Electrode architecture controls the local reaction distribution
Areal loading and coating thickness set the electrolyte-filled pore length, solid diffusion distance, current per active area, and usable capacity before voltage cutoff. Connected porosity and tortuosity determine how severely a cold-induced loss of bulk conductivity is amplified inside the coating.[10] Aggressive calendering can improve volumetric energy while increasing pore-transport polarization, and a lean electrolyte inventory can expose wetting or depletion limitations that a flooded laboratory cell conceals.
Graphite particle dimensions, morphology, surface area, and coating affect diffusion length, staging behavior, SEI burden, and kinetically accessible insertion rate. N/P ratio and overhang set average and edge inventory margin but cannot guarantee local accessibility. Separator thickness, porosity, permeability, compression, and electrolyte uptake add another transport segment before Li+ reaches graphite. At a fixed nominal C-rate, these variables can produce very different spatial reaction fields even when the average geometric current density is known.

6.2 Cell hardware controls electrical and thermal uniformity
Cell format introduces limitations that cannot be represented by a one-dimensional electrode cross-section. At the same nominal C-rate, absolute current increases with cell capacity. As cell area and capacity grow, longer current-collector paths, tab placement, weld resistance, and external contacts produce additional ohmic loss and in-plane current nonuniformity.
Mechanical and thermal boundary conditions also become less uniform. Stack pressure and interfacial contact may vary across the face of a pouch cell. Greater thermal mass and longer heat-flow paths can create core-to-surface, tab-to-edge, and center-to-edge temperature differences.[13] Local resistance generates heat, while temperature changes kinetics, resistance, and current distribution.[14] Pressure separately alters contact and pore structure.
A coin cell, a small pouch cell, and a multi-Ah pouch cell can therefore exhibit different cold polarization even when they use the same active materials and electrolyte. Transferable low-temperature studies should report tab number and location, current-collector thickness, weld and contact resistance, cell dimensions, stack pressure, fixture condition, thermal boundary, and, where possible, spatially resolved temperature, voltage, or DCIR—not only chemistry and nominal C-rate.

6.3 Minimum architecture metadata and design tensions
A transferable low-temperature result requires enough architecture metadata to explain both average performance and spatial nonuniformity.
- Lower loading shortens transport paths but reduces cell-level energy density.
- Higher porosity improves ionic transport but lowers volumetric energy density and may weaken particle contact.
- Smaller graphite particles shorten diffusion length but increase SEI area, first-cycle loss, and gas-generation risk.
- More electrolyte improves wetting and transport but lowers practical energy density.
- Weaker solvation can reduce the desolvation penalty while decreasing salt dissociation or mobile-carrier concentration.
- Greater fluorination can improve phase or interphase behavior while increasing cost, density, viscosity, or environmental burden.
- Active heating improves kinetics but adds energy consumption, mass, controls, and thermal-uniformity challenges.
7. Safe Cold Charging Requires Dynamic Current Limits
Cold discharge and cold charge fail in different ways. During discharge, increasing polarization mainly lowers the operating voltage and causes the cell to reach its lower cutoff earlier. During charge, the same transport and kinetic limitations can push a local graphite region beyond its lithium-receiving margin, allowing metallic lithium deposition to compete with insertion.
Some deposited lithium may strip during rest or the following discharge. Some may become electrically isolated or react further with the electrolyte to form additional SEI. Reversible plating can therefore be difficult to detect from capacity alone, while irreversible plating consumes cyclable lithium and electrolyte, raises impedance, and increases safety risk.
Cold-charge control should consequently be based on graphite acceptance rather than the full-cell voltage limit alone.
Adjust current with temperature and state of charge. Graphite receiving margin generally decreases as the anode approaches high lithiation. A fixed conservative current may underuse available capability at low SOC, yet exceed the safe local insertion rate near the top of charge. Current limits should therefore vary with temperature, SOC, aging state, and cell resistance.
Use staged or adaptive charge limits. Temperature, SOC, DCIR, impedance or relaxation response, and validated cell models can inform a dynamic current ceiling. CC–CV charging may be part of this strategy, but reaching the full-cell voltage limit does not itself establish that graphite remains free of plating. CV duration and dV/dt can indicate changing polarization, but neither is standalone proof.
Evaluate pulse protocols by mechanism, not only charge time. Rest periods may relax electrolyte concentration gradients and restore local insertion margin. They may also allow recently deposited lithium to strip, making a plating-prone protocol appear more reversible than it is. Pulse current, duty cycle, rest duration, temperature rise, total charge time, and post-rest behavior should all be reported.
Use complementary plating diagnostics. No single method resolves every uncertainty. Three-electrode measurements probe negative-electrode potential but may miss spatially localized high-polarization regions.[11] High-precision Coulombic efficiency and relaxation signatures reveal electrochemical consequences but are not uniquely specific to plating. Operando structural or spectroscopic methods, post-mortem analysis, and room-temperature recovery tests provide additional evidence. Spatially resolved chemical quantification has shown that irreversible plating can be strongly heterogeneous across pouch cells.[12] Conclusions are strongest when several methods agree.[7]
Can every active graphite region accept the imposed lithium flux at the stated temperature, SOC, and aging state?
8. Thermal Management Is Part of the Electrochemistry
At very low temperature, active thermal conditioning may be preferable to direct operation for high-power discharge or rapid recharge. The best strategy depends on chemistry, cell design, duty cycle, available energy, and allowable warm-up time.
External heaters and thermal plates warm the cell from its surface. Embedded foils and self-heating architectures generate heat nearer the electrode stack, while AC excitation or bidirectional pulses use internal electrical losses.[8], [9]
Electrically driven methods can also impose electrochemical cycling and polarization, so amplitude, frequency or duty cycle, SOC window, temperature rise, and electrode-potential response require validation. Methods should be compared by conditioning energy, warm-up time, added mass, uniformity, overtemperature, control complexity, and degradation—not only final temperature.
Temperature uniformity matters as much as the mean. A module averaging −10°C may still contain colder cells or colder regions within a cell. Those regions can retain higher ionic and interfacial resistance, lower graphite receiving margin, and greater susceptibility to early cutoff or lithium plating. Rapid heating can also create tab-to-core, face-to-edge, or surface-to-center gradients that are not captured by a single surface sensor.[13] Over repeated operation, thermal and current nonuniformity can reinforce spatially uneven degradation.[14]

The thermal target should therefore be operational rather than descriptive. A useful requirement might specify that the battery must deliver a defined power within two minutes after a −50°C soak, consume less than 5% of stored energy for conditioning, maintain an acceptable internal temperature spread, and keep all graphite regions within a validated non-plating condition.
A thermal strategy is successful only when the coldest electrochemically active region—not merely the mean or surface temperature—meets the performance and safety requirement.
9. A Development Framework for Ultra-Low-Temperature Cells
Ultra-low-temperature development should begin with the required duty cycle, not with an isolated solvent or additive. A disciplined program moves from application requirements to a controlled baseline, mechanism-resolved diagnostics, practical architecture, realistic validation, and an explicit thermal decision.

- Define the application. Specify storage, discharge, and charge temperatures separately, together with required energy, power, SOC window, warm-up time, lifetime, and abuse constraints.
- Lock a controlled room-temperature baseline. Hold electrode lots, loading, density, N/P ratio, separator, electrolyte quantity, formation, pressure, and cell format constant before attributing performance changes to the electrolyte.
- Characterize physical properties over temperature. Measure phase behavior, conductivity, viscosity, salt solubility, wetting, volatility, flammability, and compatibility with electrodes and current collectors. A single value at 25°C is not sufficient.
- Identify the rate-limiting processes. Combine bulk-transport measurements with graphite and cathode half-cells, full cells, matched-SOC EIS or DRT, and three-electrode measurements where possible. Apparent activation energies should be interpreted cautiously when processes overlap or deviate from Arrhenius behavior.
- Optimize the practical architecture. Co-design loading, thickness, porosity, tortuosity, particle size, separator, E/C, stack pressure, current collectors, and tab placement. Every improvement in cold power should be evaluated against its room-temperature energy and manufacturing penalty.
- Validate realistic cold protocols. Define the soak, thermal boundary, charge and discharge temperatures, rate, cutoff, recovery, and cycle count. Evaluate discharge energy, pulse power, cold recharge, plating behavior, and aged-cell response separately.
- Select the thermal strategy using system data. Compare direct cold operation, derated charging, staged charging, self-heating, and mandatory preheating on conditioning time, energy, mass, uniformity, lifetime, and safety.
A useful target is written as a constrained system problem. For example: maximize delivered energy at −40°C and 0.5C while maintaining all relevant graphite regions within a validated non-plating envelope during 0.2C recharge, with E/C below 3 g Ah−1, cathode areal capacity above 3 mAh cm−2, and conditioning energy below 3% of stored energy.
10. Minimum Reporting Standard for Claims Below −20°C
Section 6.3 identifies the architecture data needed to judge transferability. The following consolidated standard defines the minimum information needed to interpret a complete low-temperature performance claim.
| Domain | Minimum information to report |
|---|---|
| Thermal protocol | Chamber setpoint and measured cell temperature; sensor position; soak duration; temperature ramp; charge, rest, and discharge temperatures; thermal boundary; self-heating and measured temperature rise |
| Electrical protocol | Formation and preconditioning; initial SOC; C-rate and absolute current; CC–CV criteria; rest periods; voltage cutoffs; pulse duration and duty cycle; cycle count |
| Cell architecture | Format; rated and measured capacity; electrode area; cathode and anode chemistry; active-material fraction; loading; areal capacity; dry and calendered thickness; density; porosity; N/P ratio; alignment and overhang |
| Electrolyte and separator | Complete formulation and concentration basis; water specification; E/C; fill, vacuum, wetting, and formation procedure; separator chemistry, thickness, porosity, and permeability; electrolyte thermal and phase history |
| Performance | Full voltage curves; capacity; delivered Wh; average discharge voltage; power; DCIR or EIS at matched SOC; Coulombic efficiency; normalization denominator; replicate count; uncertainty or cell-to-cell variation |
| Charge safety | Negative-electrode potential where available; plating diagnostics; relaxation and recovery behavior; gas or swelling; self-discharge; post-mortem evidence; aged-cell validation |
This information distinguishes a phase-stability result, a low-rate cold discharge, a power demonstration, and validated cold rechargeability.
11. Implications for Materials Development
Electrolyte development should begin with a defined electrode and cell architecture. Solvent and salt selection determine phase behavior, conductivity, viscosity, solvation, electrochemical stability, and interphase precursors. Graphite grade determines particle diffusion length, surface area, morphology, tap density, and SEI demand. Cathode and anode loading, porosity, and balance determine the lithium flux that the graphite must receive. Finished-electrode processing turns these materials into actual ionic, electronic, and thermal transport paths.
The development target should therefore be a coupled specification rather than a request for “the best low-temperature solvent.” At minimum, it should define the target temperature and duty cycle, cell chemistry and voltage, electrode areal capacities and porosities, N/P ratio, E/C, formation protocol, required energy and power, allowable conditioning time, and the evidence required to exclude unacceptable lithium plating.
References and Figure Rights
Figure rights. Original conceptual illustrations and the design and annotations of Winigen-created replots are © Winigen Materials. Selected numerical data from Chen et al. were replotted under CC BY 4.0; each adapted figure identifies its source and modifications. No complete journal figure is reproduced. Third-party data remain subject to the licenses and attributions stated in the relevant captions.
- Chen, Y. et al. Breaking solvation dominance of ethylene carbonate via molecular charge engineering enables lower temperature battery. Nature Communications 14, 8326 (2023). doi:10.1038/s41467-023-43163-9. CC BY 4.0.
- Zhao, Y.; Geng, L.; Meng, W.; Ye, J. Low-Temperature Electrolytes for Lithium-Ion Batteries: Current Challenges, Development, and Perspectives. Nano-Micro Letters 18, 65 (2026). doi:10.1007/s40820-025-01914-x. CC BY 4.0; third-party figure exclusions apply.
- Xu, J. et al. Electrolyte design for Li-ion batteries under extreme operating conditions. Nature 614, 694–700 (2023). doi:10.1038/s41586-022-05627-8.
- Zhan, J. et al. Cell Design for Improving Low-Temperature Performance of Lithium-Ion Batteries for Electric Vehicles. Batteries 9, 373 (2023). doi:10.3390/batteries9070373. CC BY 4.0.
- Lu, D. et al. Ligand-channel-enabled ultrafast Li-ion conduction. Nature 627, 101–107 (2024). doi:10.1038/s41586-024-07045-4.
- Jeong, D.; Tackett, B. M.; Pol, V. G. Tailored Li-ion battery electrodes and electrolytes for extreme condition operations. Communications Chemistry 8, 170 (2025). doi:10.1038/s42004-025-01564-5. CC BY-NC-ND 4.0; adapted material is not permitted under the license, and third-party exclusions may apply.
- Waldmann, T. et al. Li plating as unwanted side reaction in commercial Li-ion cells: A review. Journal of Power Sources 384, 107–124 (2018). doi:10.1016/j.jpowsour.2018.02.063.
- Yang, X.-G. et al. Fast charging of lithium-ion batteries at all temperatures. Proceedings of the National Academy of Sciences 115, 7266–7271 (2018). doi:10.1073/pnas.1807115115.
- Zeng, X. et al. Extreme fast charging of commercial Li-ion batteries via combined thermal switching and self-heating approaches. Nature Communications 13, 6615 (2022). doi:10.1038/s41467-022-34037-3.
- Lu, X. et al. 3D microstructure design of lithium-ion battery electrodes assisted by X-ray nano-computed tomography and modelling. Nature Communications 11, 2079 (2020). doi:10.1038/s41467-020-15811-x.
- Finegan, D. P. et al. Spatial dynamics of lithiation and lithium plating during high-rate operation of graphite electrodes. Energy & Environmental Science 13, 2570–2584 (2020). doi:10.1039/D0EE01191F.
- Paul, P. P. et al. Quantification of heterogeneous, irreversible lithium plating in extreme fast charging of lithium-ion batteries. Energy & Environmental Science 14, 4979–4988 (2021). doi:10.1039/D1EE01216A.
- Lin, J.; Chu, H. N.; Howey, D. A.; Monroe, C. W. Multiscale coupling of surface temperature with solid diffusion in large lithium-ion pouch cells. Communications Engineering 1, 1 (2022). doi:10.1038/s44172-022-00005-8.
- Li, S. et al. Effect of thermal gradients on inhomogeneous degradation in lithium-ion batteries. Communications Engineering 2, 74 (2023). doi:10.1038/s44172-023-00124-w.
Develop an Ultra-Low-Temperature Cell Stack
Share the target temperature and duty cycle, cathode and anode chemistry, areal loading, N/P ratio, E/C, cell format, voltage window, warm-up allowance, and required validation evidence. Winigen Materials can support electrolyte formulation, graphite and cathode selection, finished-electrode design, and practical-cell validation.
Contact Winigen MaterialsOriginal Winigen Materials illustrations, figure layouts, annotations, and article text are © Winigen Materials. Third-party data remain subject to the licenses and attributions stated in the relevant figure captions.